TwinEdge / Operations Intelligence · On the mapOperations Intelligence
Equipment on a map
Put the condition in its location.
Connect assets, telemetry, networks, and field work on the map. Trace where an issue starts and which equipment depends on it.
Questions only a map answers
- 01If we shut this valve, who loses supply?
- 02What is upstream of the reading that went bad?
- 03Which jobs are near the crew already out there?
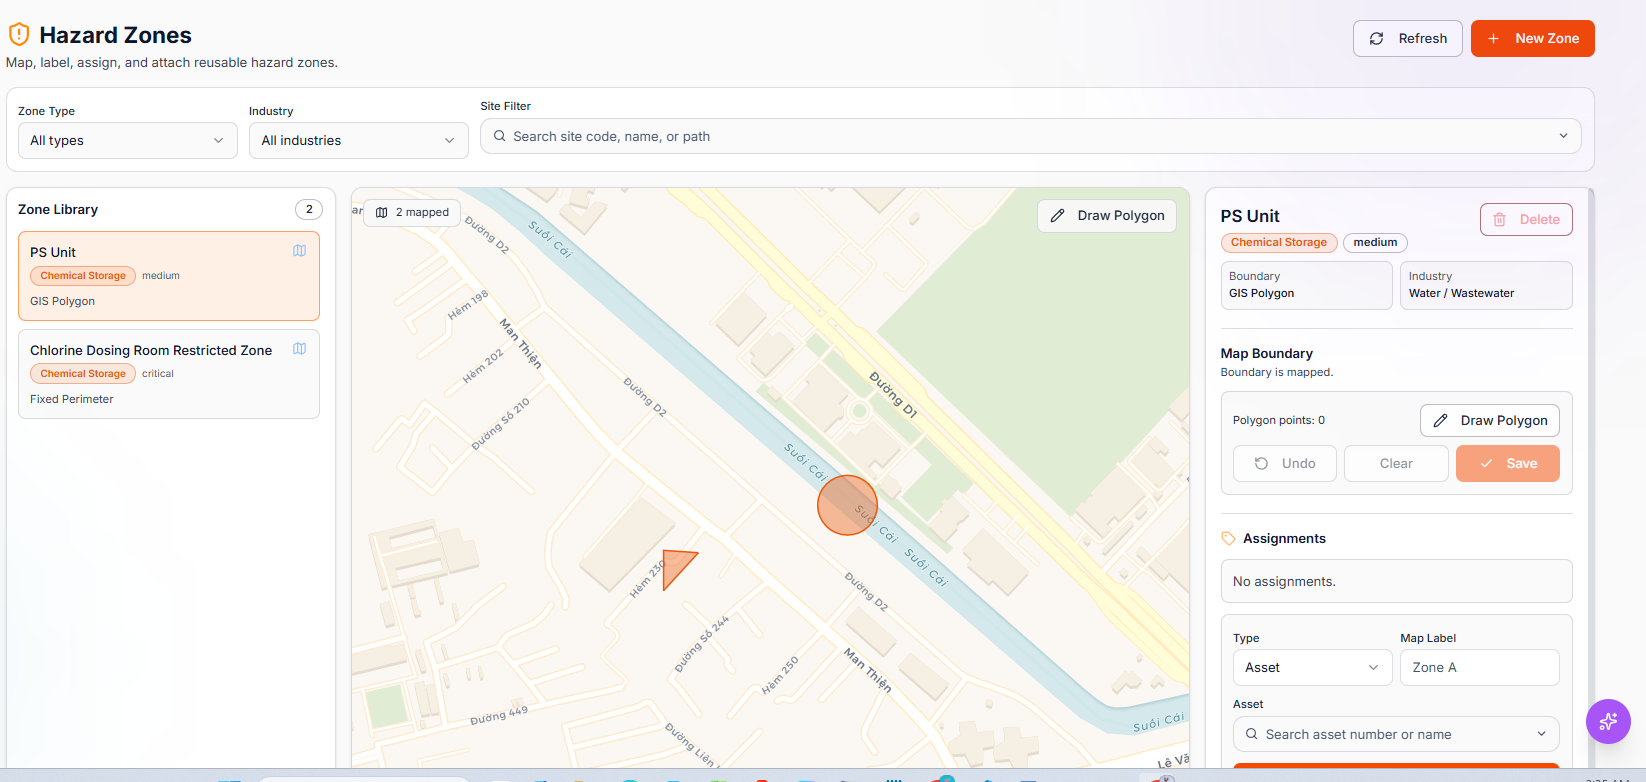
- 04What sits inside this hazard zone?
- 05Which of next year’s replacements are on one street?
§ 01
What it does.
- 01Everything where it actually is
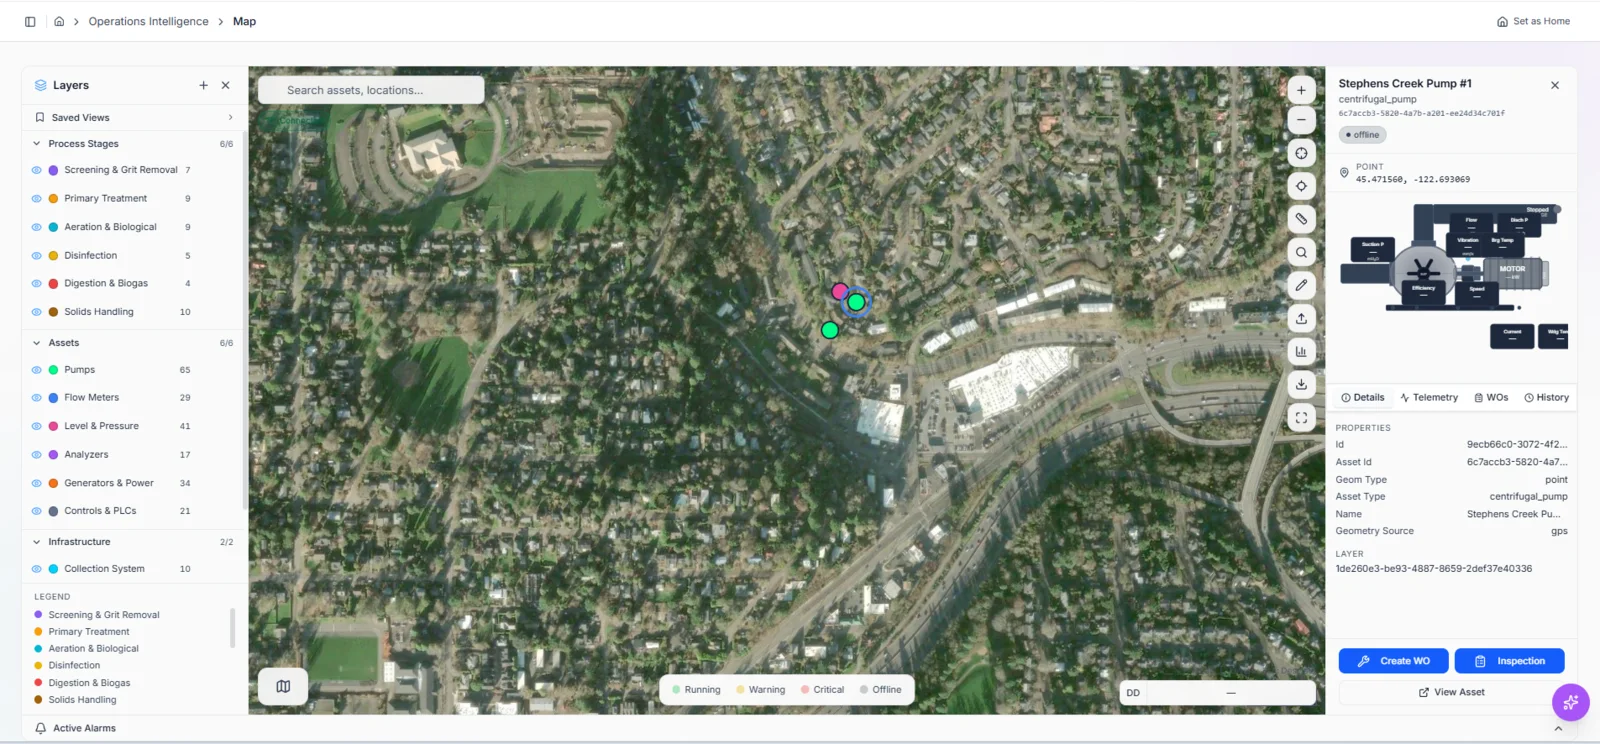
Machines, jobs, scheduled inspections, readings, documents, alarms, service areas, and the zones you have to respect, all in one place on the map.
- 02Networks, not just pins
Pipes, valves, hydrants, mains, pressure zones, and lift stations modelled as a connected network, so you can ask what is upstream of a problem and who loses supply.
- 03Planning the day geographically
Where the work is, where the crews are, which areas belong to whom, and how long it takes to get between jobs.
- 04Asking spatial questions
Everything within a radius, inside an area you draw, nearest to a point, or connected along the network. That last one is how you answer “what does this shutdown affect”.
- 05Risk and capital, on the map
Replacement plans, the year each is scheduled, the risk ranking, the cost, and hazard overlays, so a spending argument can be had over a map rather than a spreadsheet.
- 06Bringing your own layers
Import and export, saved views, base maps, layer groups, and styling, so the map matches what your team already uses.
§ 02
What it looks like in use.
§ 03
Why it is not a separate mapping system.
Most organisations already have a mapping system, and it is usually excellent at mapping and entirely unaware of what the equipment is doing right now. So the map shows where the pipe is, and a different screen shows that its pressure has been falling for a fortnight.
Here they are the same record. The thing you click on the map is the same machine that has readings, a maintenance history, a model, and open jobs. You can keep your existing mapping system and bring its layers in.
“Not the base map. That clicking something on it does something.”
What makes a map operational
§ 04
What it reads and writes.
Your existing layers come in; what you build here goes back out.
- Esri layers
- Shapefiles
- GeoJSON
- KML
- Vector tiles
- WMS and WFS
- CSV with coordinates
- PostGIS
Bring one network and one week of work.
We load your layers, attach the live readings to what is on them, and then ask the question your current map cannot: if this fails, who is affected?