Industrial AI for asset-intensive operations
The AI-native operating layer for live industrial assets.
TwinEdge reads your assets live, grounds every signal in a physics-based digital twin, and turns it into an approved action — connect, diagnose, act, learn. On the systems you already run. Not a dashboard. Not a CMMS.
Co-developed with operators and system integrators. Deploys alongside SCADA, historians, GIS, and your existing CMMS/EAM — never a forced rip-and-replace.
Edge ingest
Modbus signal streamed & stored on TwinEdge OS
Twin context
Physics twin + operating envelope applied
Diagnose
Bearing degradation · RUL ~18 days · 0.86 conf
Governed action
Drafted with evidence — routed for approval
Replace pump bearing · Priority High
Live example — from edge signal to a governed action.
Connects to the protocols, historians, SCADA, GIS, and CMMS/EAM you already run
How it works
One loop: connect, diagnose, act, learn.
Every other industrial tool stops at a dashboard or a ticket. TwinEdge closes the loop from the live signal to an approved action — and gets smarter each time it runs.
Read the live asset
TwinEdge OS reads SCADA, PLCs, historians, and meters over OPC UA, Modbus, MQTT, BACnet, and more — on the systems you already run.
Ground it in physics
A physics-based twin of each pump, blower, or treatment unit turns raw signals into condition, failure mode, and root cause — not just a red dashboard.
Recommend governed action
Agents draft the work order, energy fix, or compliance record with evidence attached — and a human approves before anything executes.
Improve every time
Approvals, rejections, closeout notes, and real failures feed back so the next recommendation is sharper than the last.
Four products, one connected operating layer
Measured, not modeled · TwinEdge OS edge benchmark
20,333 readings/s ingested and durably stored — 13% lower latency than Siemens' public 20K reference.
The TwinEdge OS data plane (C / open62541 with Apache IoTDB) processed and stored a 20,000-tag OPC UA stream with a perfect store ratio, zero sequence gaps, and zero replay backlog — beating Siemens' published 20K live-value reference.
See the full edge benchmark20,333/s
stored readings
20,000-tag tier, 100 ms publish — 1.000 store ratio.
13.0%
lower latency
15 ms faster than the Siemens public 20K reference.
Zero
gaps or backlog
Durable append plus Apache IoTDB across the full stream.
Competitive local benchmark against Siemens' published IIH 20K live-value reference — not a hardware certification. Production sizing should be validated on your target hardware.
See it running
The live operating layer, on real assets.
Physics insights, GIS-aware operations, AI-drafted maintenance, WaterOS, governed agents, and the TwinEdge OS edge — one connected path from live signal to approved work.

Physics-driven asset insights
Physics-based anomaly context, energy waste, cost impact, and action-ready recommendations in one review surface.

GIS + asset digital twin
Operational map with layer controls, asset selection, work and inspection actions, telemetry, and twin context.
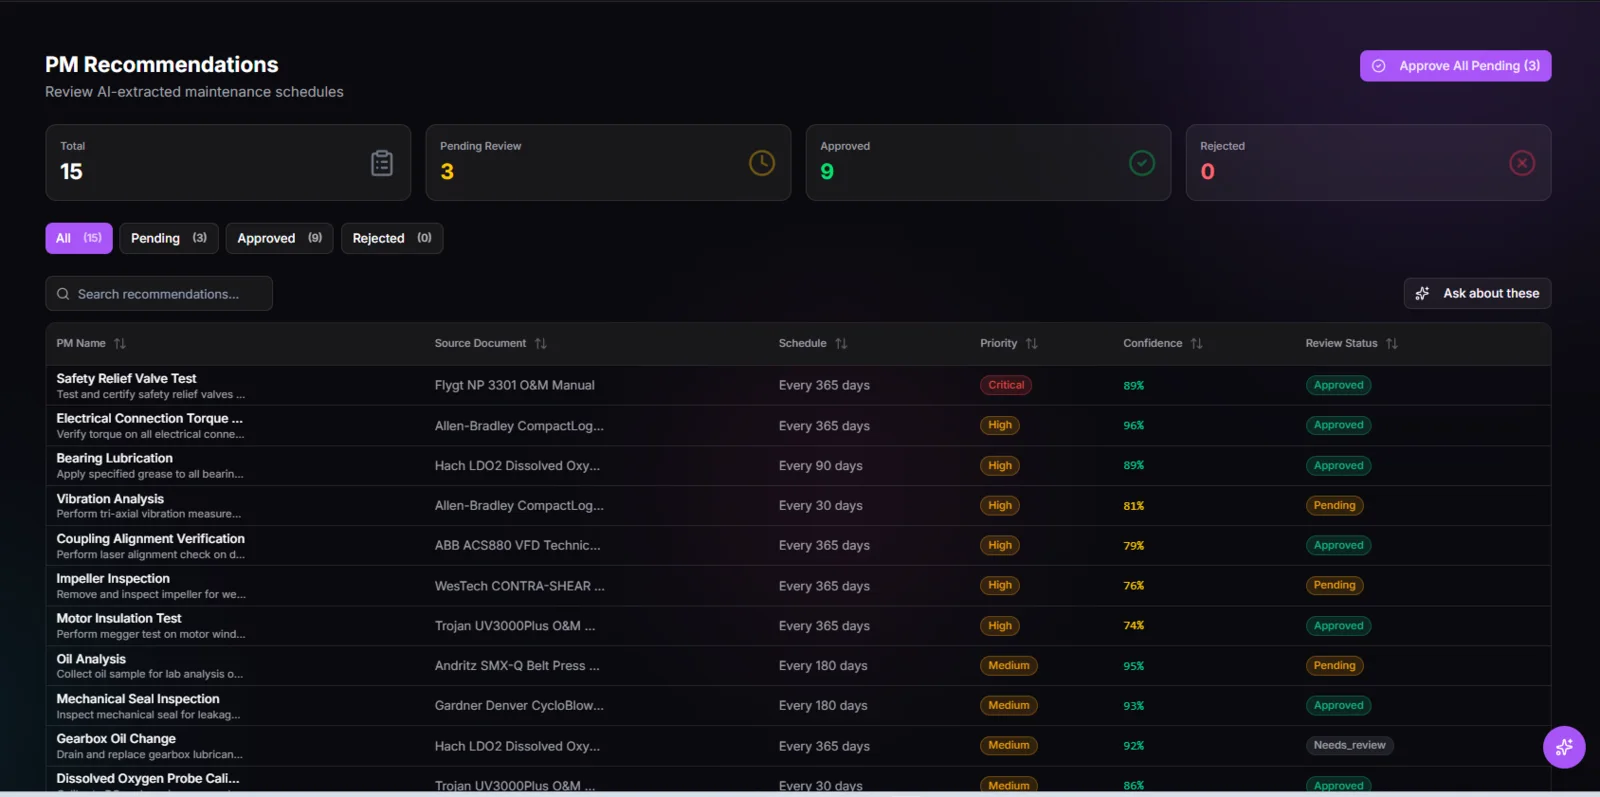
AI PM recommendations
O&M-derived preventive maintenance recommendations with confidence, source documents, and approval state.
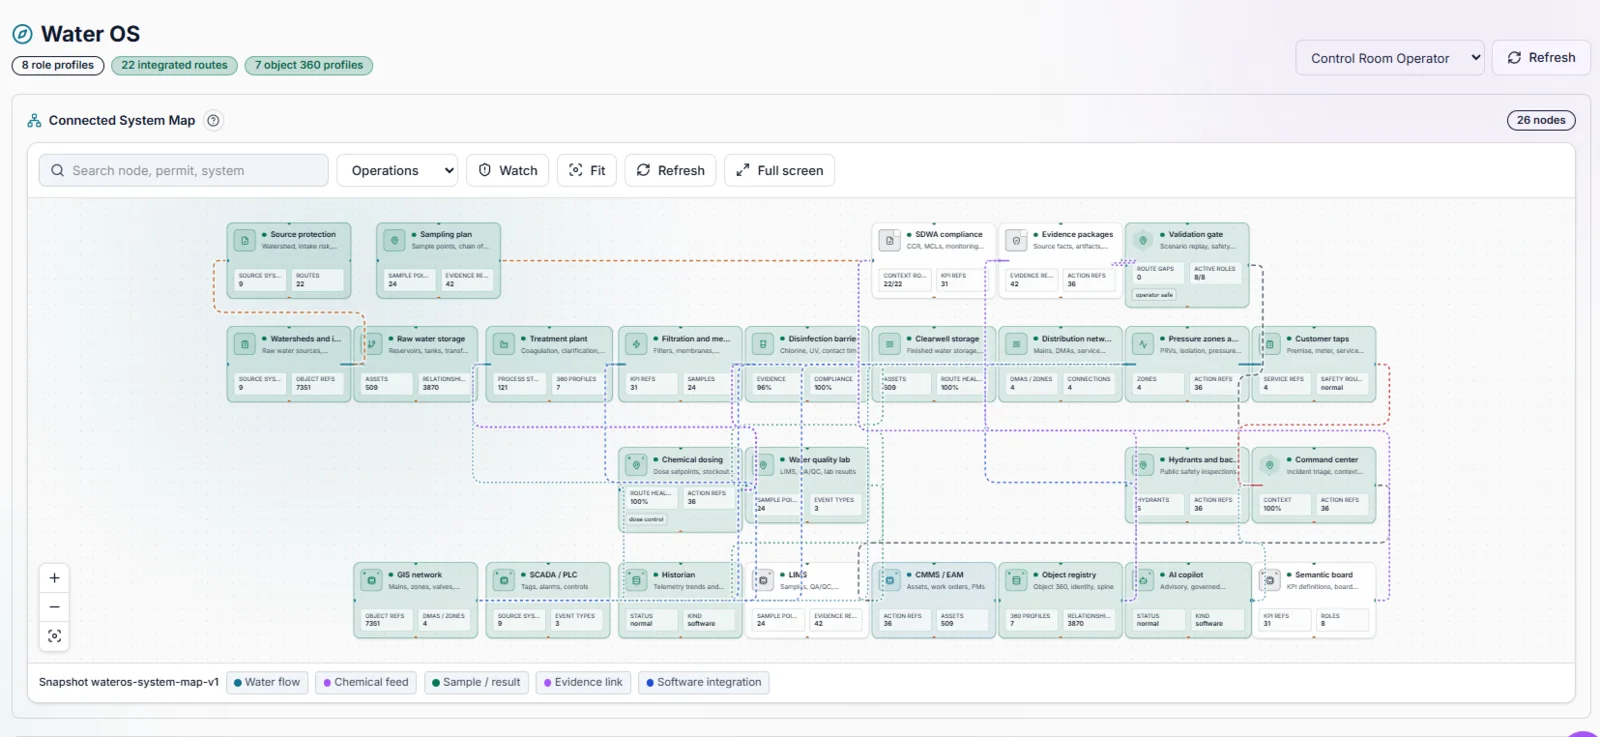
WaterOS connected system map
Water operations modeled as connected systems: treatment, storage, pressure zones, compliance, SCADA, LIMS, and CMMS.
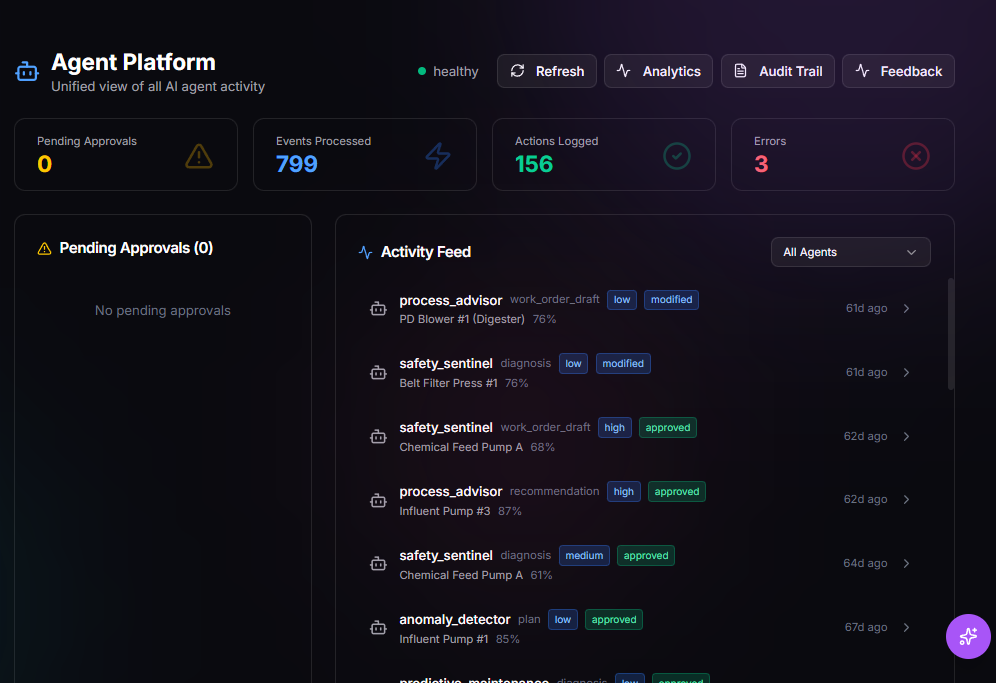
Agent Hub and governed agents
Live agent activity, approvals, and impact across packaged industrial agents — humans stay in control.

TwinEdge OS protocol adapters
Local protocol access, edge configuration, and no-cloud evaluation paths in the TwinEdge OS admin console.
Old way vs TwinEdge
CMMS/EAM records the work. TwinEdge understands the live asset.
TwinEdge is built for teams that already have systems of record. It adds the connected, physics-grounded operating layer those systems were never built to provide — without a rip-and-replace.
Old way
Your CMMS/EAM is a static record. The asset, the manual, the map, and the live data all drift apart.
TwinEdge way
TwinEdge connects them into one live twin — signals, documents, GIS, work, parts, and failure modes around the real asset.
Old way
PMs run on the calendar even when condition, load, and physics say otherwise.
TwinEdge way
Recommendations use physics-based degradation, condition, failure history, crew windows, and parts readiness.
Old way
Generic AI chat answers questions but never closes the operational loop.
TwinEdge way
Governed agents explain, draft, route approvals, execute the handoff, and learn from the outcome.
Modeled impact
What a physics-grounded operating layer is built to deliver.
Modeled outcomes from TwinEdge's physics-based digital twins and optimization on representative water and wastewater assets.
up to0%
fewer sanitary sewer overflows
Modeled from wet-well level control and force-main hydraulics.
up to0%
lower energy spend
Designed via pump and VFD efficiency optimization against the pump curve.
up to0%
fewer manual inspections
From continuous online condition assessment replacing routine rounds.
Projections from physics-based digital-twin simulation. Actual results vary by site, asset condition, and operating context.
Where we lead
Water and wastewater first. Built to expand across industrial operations.
Pump Station Twin is the flagship entry point because it is concrete: telemetry, pump behavior, GIS context, energy, maintenance risk, PM optimization, and evidence-backed recommendations — live.
Pump Station Twin
Lift Station Twin
Treatment Plant Twin
Water Quality & Regulatory
Explore the platform
One operating layer. The products you build on and the applications you run.
The platform layer connects and governs your assets. Industry applications turn that foundation into the day-to-day operations your teams live in.
Platform
Industry applications
See all productsCommon questions
What operations leaders ask before they start.
Straight answers to the questions that decide whether a platform like this fits a real industrial operation.
Do we have to rip and replace our CMMS, SCADA, or historian?
No. TwinEdge is an operating layer that runs alongside the systems you already have — SCADA, historians, MQTT, GIS, CMMS/EAM, LIMS, and ERP. Start with one source and one asset class.
How are the AI agents kept safe and auditable?
Every agent is approval-first and tenant-scoped, with credential redaction, physics-grounded evidence on each recommendation, dry-run plans, and replayable decision history. Nothing executes without a human approving it.
What are the deployment options?
Cloud connector, on-site Collector, OT Bridge, or TwinEdge OS running fully on-prem at the edge. You can also download TwinEdge for a no-cloud technical evaluation.
How fast do we see value?
The adoption path is deliberately narrow: one source, one asset class, one governed recommendation workflow — then expand. Starter packages get a pump or lift station twin live without a multi-quarter program.
See it on your assets
Request a demo tailored to your operation.
Tell us your industry and what you run today. We'll show you the live operating layer on assets like yours — physics twins, failure diagnosis, governed recommendations, and the auto-drafted work order.
- Walkthrough on your asset class and protocols
- No rip-and-replace — layered on your CMMS/EAM, SCADA, and GIS
- Or download TwinEdge for a no-cloud technical evaluation
We'll follow up within 1 business day.