TwinEdge Sustainability and ESG

Sustainability and ESG workflows tied to assets, telemetry, factors, targets, and disclosures.

TwinEdge Sustainability and ESG supports emissions factor libraries, asset energy profiles, emission events, telemetry and invoice ingestion, rollups, reduction targets, disclosure workflows, and reduction scenario simulation.

Sustainability and ESG operating loopTwinEdge turns industrial activity, science, physics, assets, and EAM work into auditable ESG evidence.Scope 1Scope 2Scope 3DATA SOURCESTWINEDGE INDUSTRIAL OPERATING SYSTEMESG EVIDENCEOT tagsSCADA/historianMetersenergy + waterInvoicesERP + utilityGIS/riskweather + mapsshared context for DataOps, assets, EAMField, APIs, MCP, and approved AIDataOpslineage, qualityfactor versionsScience + physicsmass/energyload curvesAsset + EAMequipment, workfield closeoutESG controlstargets, scenariosdisclosuresCO2e = activity x EFRisk = H x exposurekWh per asset outputCO2e ledgerScope 1/2/3TargetsabatementRiskhazardsDisclosureframeworksCLOSED LOOP TO OPERATIONSBaselineasset intensityScenariophysics what-ifEAM workrepair / PMField proofcloseout dataReportaudit packageAccepted ESG actions flow back into asset plans, EAM work orders, field evidence, and disclosure packages.

Emission factors

Energy profiles

Scope 1/2/3 events

Targets

Disclosures

Simulation

Sustainability and ESG connects operating activity to auditable disclosure evidence.

Actual ESG product screens

Carbon accounting, disclosure, and climate-risk screens tied to the operating layer

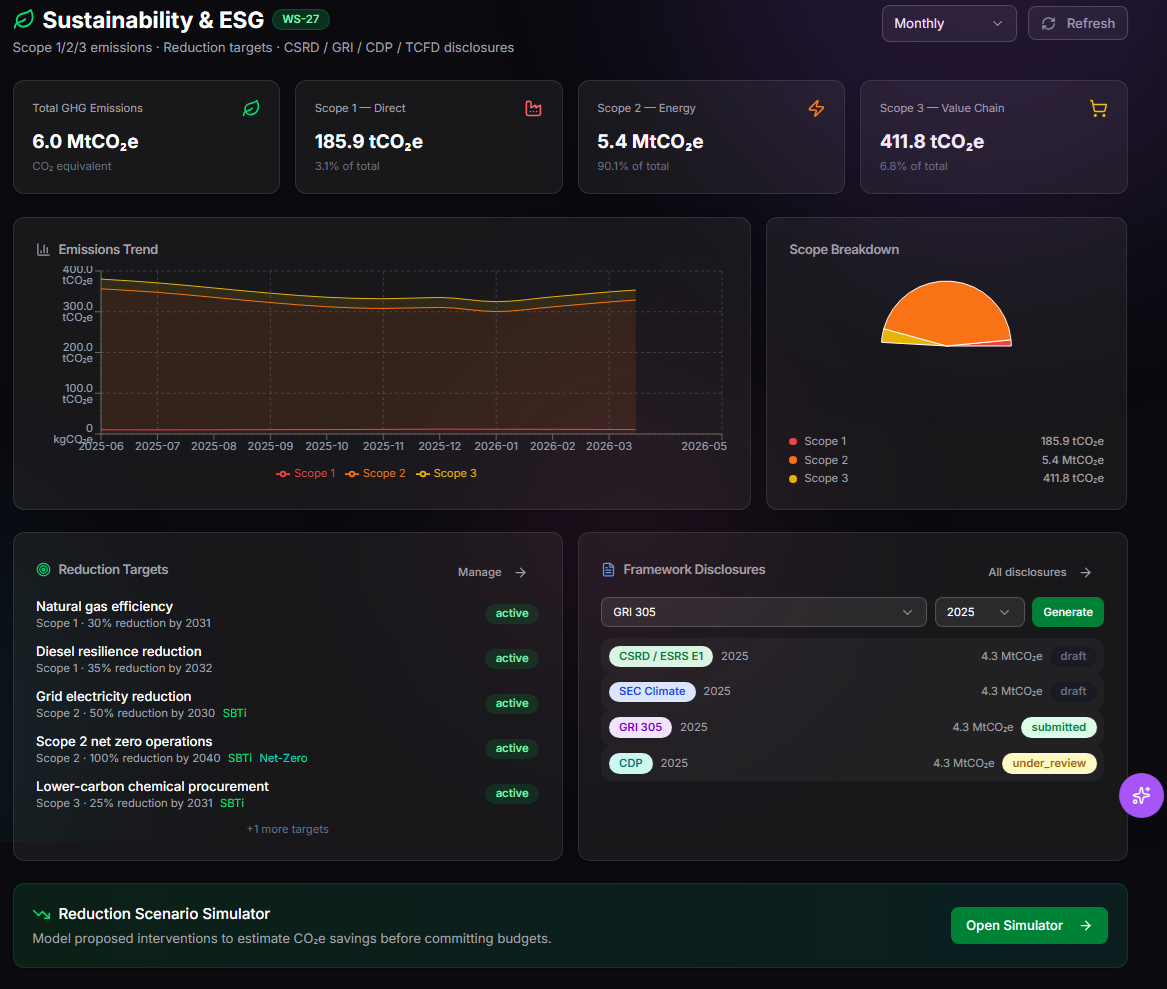
These Sustainability and ESG screenshots show how TwinEdge connects activity data, emission events, reduction targets, framework mapping, disclosure assembly, physical-risk scenarios, and per-asset hazard evidence.

TwinEdge Sustainability and ESG carbon accounting dashboard showing Scope 1, Scope 2, Scope 3, source quality, reduction progress, and evidence status
Carbon accounting

Scope 1, 2, and 3 carbon accounting dashboard

The operating board rolls up emissions by scope, category, source quality, target progress, and evidence status.

TwinEdge Sustainability and ESG emission events screenshot showing emissions ledger rows, scopes, categories, factors, activity data, and review status
Emission events

Emission event ledger

Emission events preserve activity data, factor choices, calculation status, ownership, and review evidence for audit replay.

TwinEdge Sustainability and ESG reduction targets screenshot showing baseline, current emissions, target progress, forecast, and reduction programs
Targets

Reduction target tracking

Targets connect baseline, current performance, committed reductions, forecast progress, and accountable operating programs.

TwinEdge Sustainability and ESG frameworks screenshot showing reporting frameworks, evidence mapping, readiness status, and disclosure controls
Frameworks

Reporting framework mapping

Framework views map evidence and controls to disclosure structures so teams can track readiness across reporting requirements.

TwinEdge Sustainability and ESG disclosure builder screenshot showing disclosure sections, evidence references, status, and reviewer workflow
Disclosures

Disclosure builder

Disclosure packages assemble emissions, water, risk, target, and evidence sections with review status and traceable references.

TwinEdge Sustainability and ESG climate physical risk dashboard showing hazards, exposed assets, risk levels, scenarios, and mitigation planning
Physical risk

Climate physical-risk dashboard

Physical-risk views connect hazards, exposed assets, locations, climate context, and mitigation planning into the same operating record.

TwinEdge Sustainability and ESG climate scenarios screenshot showing hazard pathways, time horizons, exposure levels, and adaptation priorities
Scenarios

Climate scenario analysis

Scenario surfaces compare hazard pathways, asset exposure, time horizons, and adaptation priorities for operational planning.

TwinEdge Sustainability and ESG per-asset hazards screenshot showing physical climate hazards, asset exposure, GIS context, and mitigation work evidence
Asset risk

Per-asset hazard evidence

Asset-level risk records keep hazards, GIS context, operational exposure, mitigation work, and evidence tied to the asset graph.

Workflow

From operating data to disclosure evidence

TwinEdge starts with live industrial and enterprise sources, maps them to asset physics and EAM context, then turns the resulting ESG evidence into targets, risk views, and disclosure packages.

Collect activity data

Use telemetry, meter readings, historian tags, invoice lines, ERP records, supplier data, weather, GIS, asset profiles, and site context to create auditable emission events.

Apply science, physics, and factors

Use mass and energy balance, equipment load curves, process coefficients, water-loss models, and emission factors to calculate and validate ESG rollups.

Connect assets to action

Tie emissions, hazards, targets, and scenarios to EAM assets, maintenance work, field tasks, capital plans, and disclosure evidence on the TwinEdge operating layer.

Capabilities

What sustainability teams can manage

TwinEdge keeps sustainability work connected to operations, asset records, source data, and reviewable evidence instead of isolating ESG reporting in spreadsheets.

Science-backed emissions tracking

Emission events combine activity data, factors, meter readings, process context, and asset energy profiles into traceable CO2e calculations.

Targets and operational planning

Reduction targets, progress checks, net-zero roadmap, abatement scenarios, and climate-risk adaptation plans stay tied to accountable assets and work.

Disclosure support

Disclosure records, status advancement, chain of custody, board ledger, water-loss carbon, and framework-oriented reporting surfaces use the same evidence base.

Science and physics layer

ESG calculations stay grounded in physical operating context.

TwinEdge combines factor libraries with asset-specific physics so carbon, energy, water, and climate-risk evidence reflects how the site actually operates.

Mass and energy balance

Production, pumping, HVAC, process, utility, and water-loss models turn raw activity into explainable intensity and CO2e signals.

Asset operating envelopes

Equipment curves, rated capacity, runtime, duty cycles, and condition data help separate normal energy use from avoidable waste.

Factor governance

Emission factor versions, category mapping, scope assignment, confidence, and reviewer decisions remain attached to every calculated event.

Asset and EAM loop

Sustainability improvements become operational work.

The ESG record is connected to the same asset graph, work-order paths, field evidence, and capital planning workflows used by operations.

Asset-connected emissions

Meters, invoices, telemetry, and process activity map to equipment, facilities, fleets, suppliers, and production lines.

EAM work handoff

Accepted reduction or adaptation actions become maintenance plans, inspections, corrective work, field tasks, or capital projects.

Closed-loop evidence

Before and after readings, work completion, cost, avoided emissions, hazard mitigation, and reviewer signoff remain available for audit.

Engineering controls

Controls for auditable Sustainability and ESG evidence.

TwinEdge Sustainability and ESG is designed for evidence-backed reporting and operational review, not uncontrolled claims or opaque carbon math.

Traceable calculations

Activity data, factor version, physical assumption, source confidence, scope, category, and reviewer status stay attached to emission events.

Operational approval

Reduction actions and adaptation work move through EAM, Field, capital, and disclosure review paths before they are counted as complete.

Scenario transparency

Targets, climate pathways, hazard exposure, and abatement scenarios keep assumptions visible for review and audit.

Source system respect

TwinEdge works above SCADA, historians, meters, ERP, EAM, GIS, disclosure tools, and data lakes rather than replacing them.

Outcomes

ESG outcomes for industrial operators

Teams get a shared line of sight from source activity and asset behavior to reported performance, risk exposure, and approved reduction work.

Operations teams

Connect energy and water-loss context to measurable sustainability impact.

Sustainability teams

Move from manual spreadsheets to auditable events, factors, targets, and disclosure workflows.

Executives

Review progress, risks, and reduction scenarios with traceability back to source activity.

Connected platform

How Sustainability and ESG fits the TwinEdge industrial operating system

Sustainability and ESG uses the same context layer as DataOps, AssetOps EAM, Field, Facility OS, Water OS, Wastewater OS, Capital Planning, APIs, and MCP.

DataOps connects SCADA, historians, meters, invoices, ERP, GIS, weather, supplier files, and external factor data.

Physics-aware models translate activity into asset energy profiles, intensity baselines, water-loss carbon, and climate exposure.

AssetOps EAM links emissions, hazards, and target actions to equipment, work orders, preventive maintenance, and reliability programs.

Field and Facility OS capture inspections, meter checks, energy actions, adaptation work, photos, notes, and closeout evidence.

Capital Planning turns accepted reduction and resilience scenarios into funded projects, lifecycle models, and executive plans.

APIs and MCP expose governed ESG context to disclosure systems, BI, enterprise reporting, and approved AI workflows.

Evaluate TwinEdge

Build an ESG workflow that operations can prove.

Review how TwinEdge can connect your asset data, source systems, physics assumptions, EAM workflows, and disclosure requirements into one governed Sustainability and ESG operating loop.